Key insights from the 48 entries to the Stackie Awards, an annual contest that challenges companies to visualize their martech stacks. Curated by Pricepoints! Author Jacqueline Dooley, Click Z
There is no perfect martech stack. Each stack is custom fit to match a company’s industry sector, marketing approach, and unique needs.
The Stackies don’t require entrants to stick with specific categories, but most included variations of the following: planning/strategy, Creative, Engagement/Marketing, Customer, and Measurement/Analytics.
The Stackies challenge entrants to visualize the tools in their martech stack, illustrating how each marketing category is connected.
This helps clarify a company’s marketing and digital transformation strategies, shedding light on how they’re using technology to facilitate operations, work with customers, and approach prospecting, nurturing, and sales.
It also illuminates how companies track and measure their customers and marketing initiatives.
There is no ideal martech stack
It’s a good thing I wasn’t expecting to have an epiphany about what the perfect martech stack looks like because, just like fingerprints, each Stackie entry is unique.
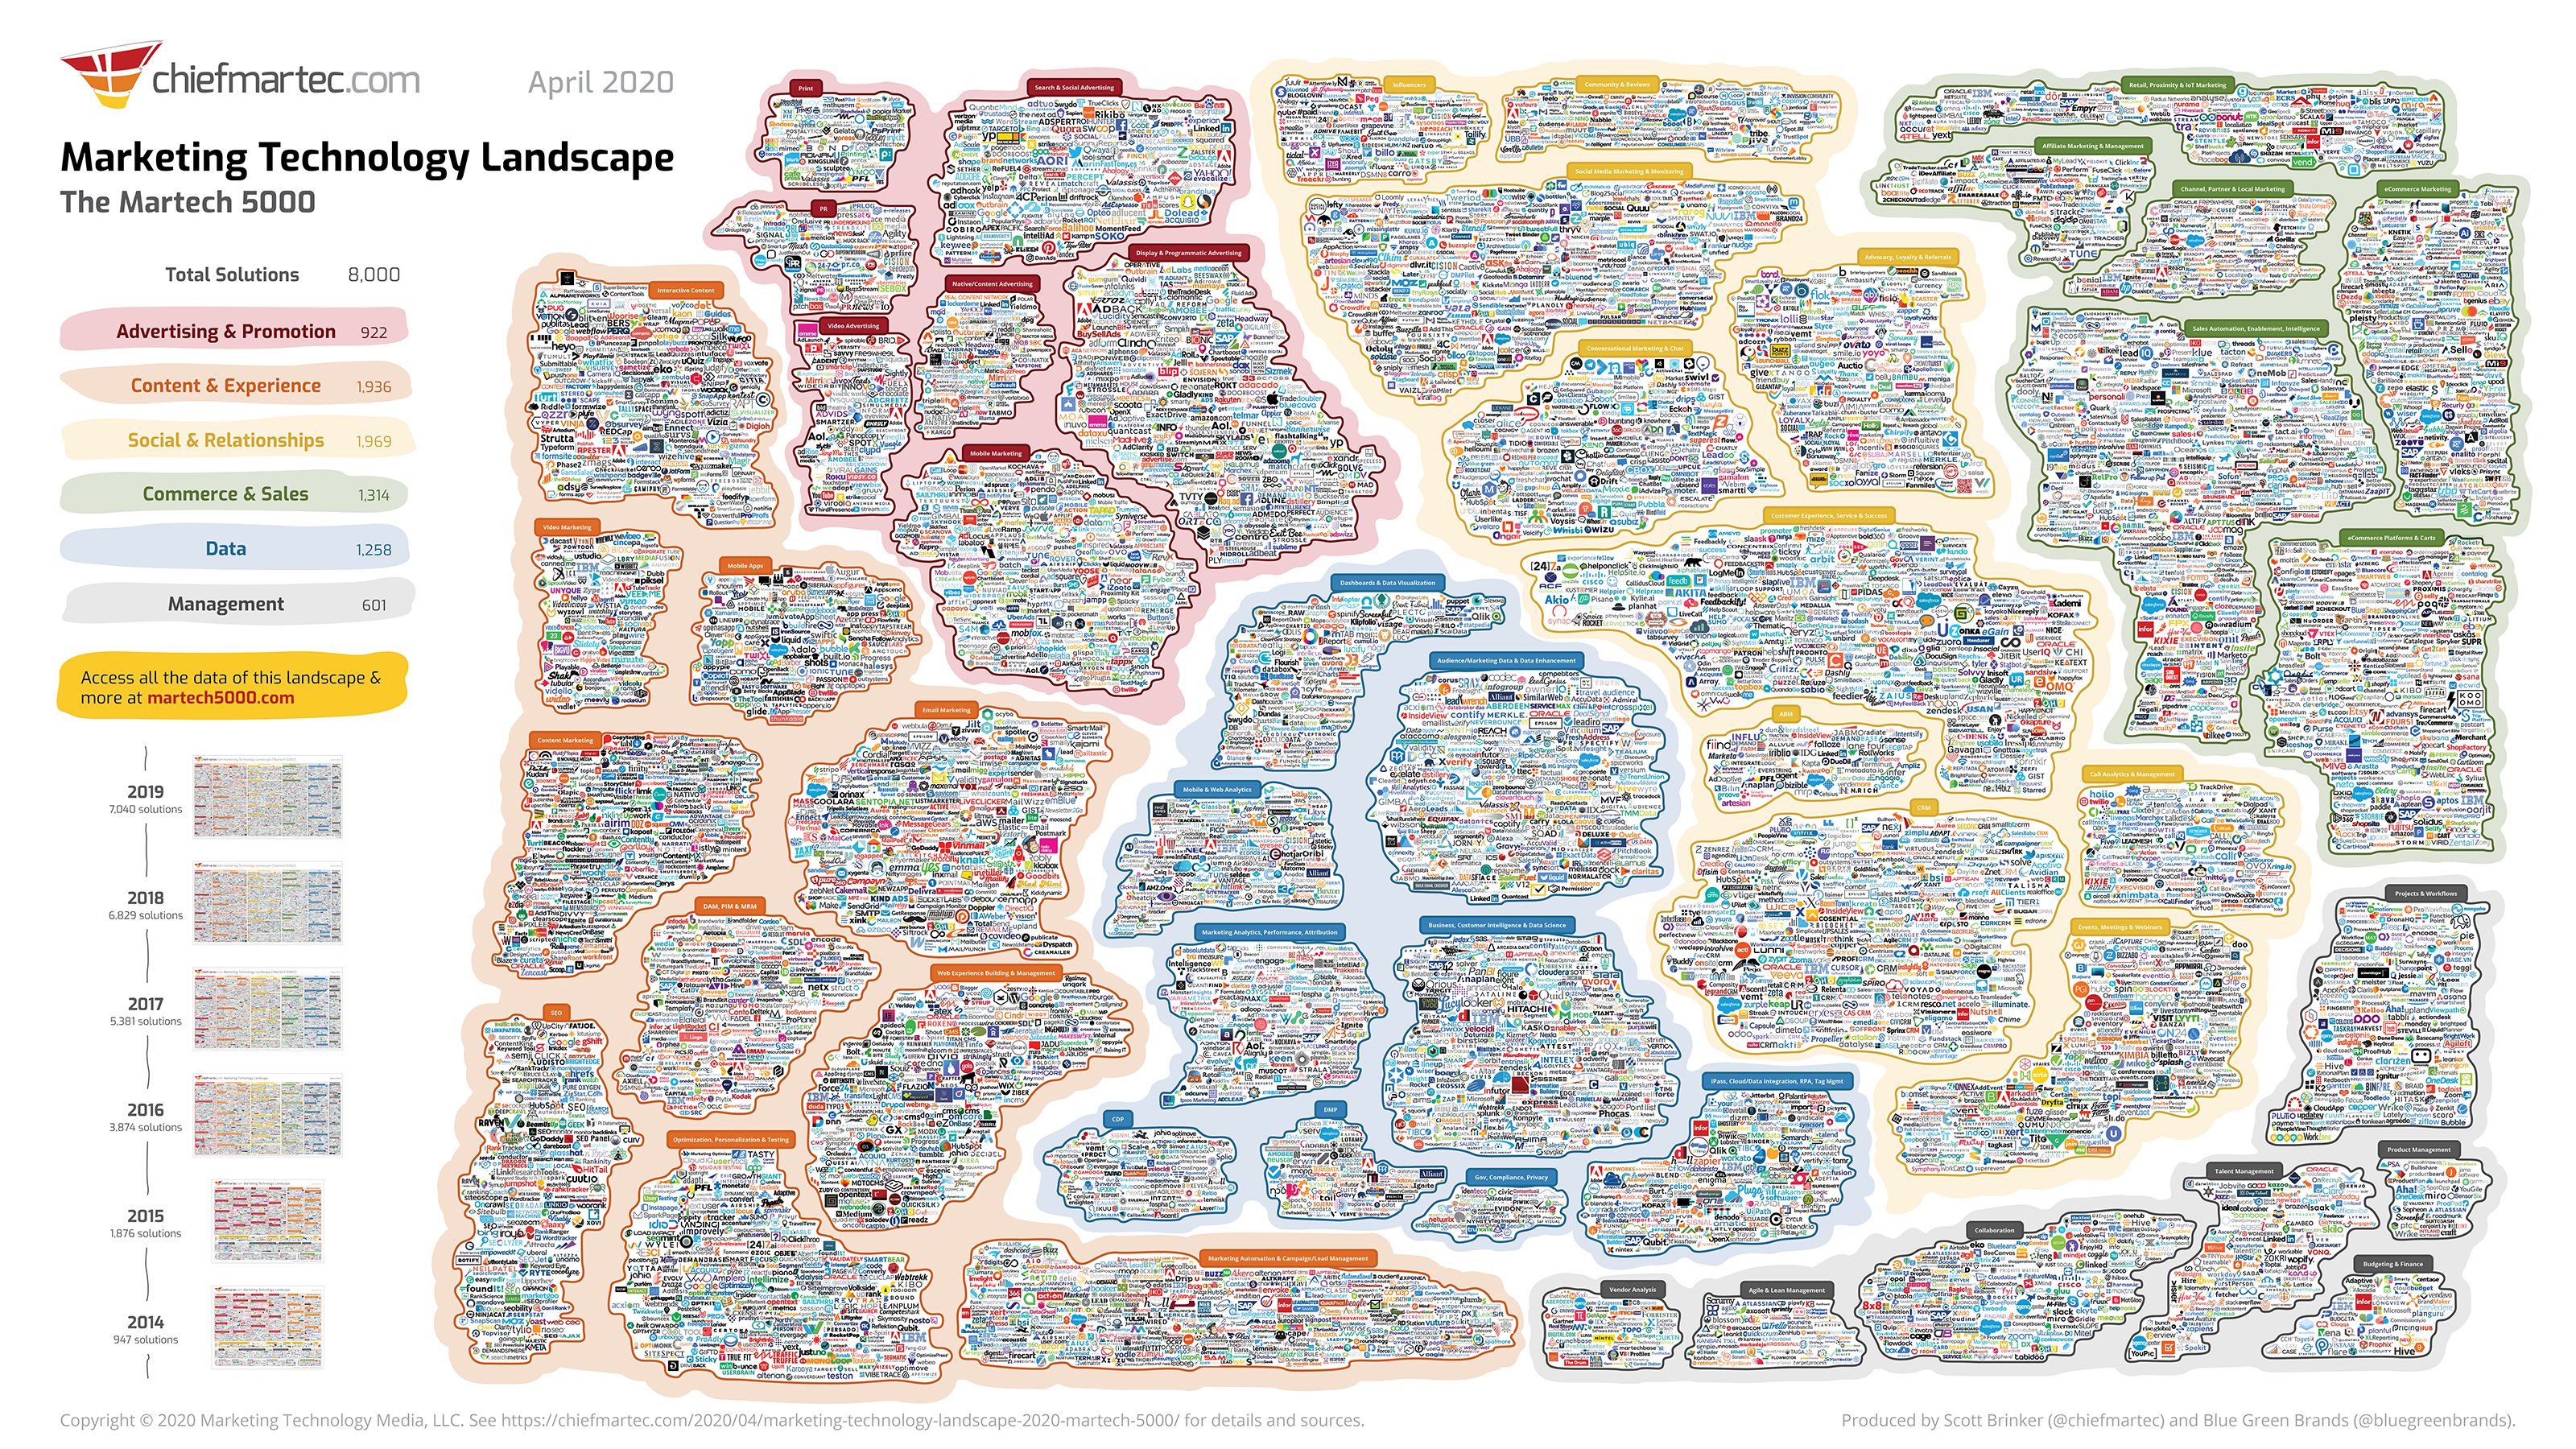
That’s not surprising considering the martech technology landscape contains more than 8000 martech solutions across six main categories and numerous subcategories.
The Stackies don’t limit entrants to a specific number of categories, so one of the most interesting aspects of each visualization (in my opinion) is how entrants chose to categorize their tech solutions.
AB InBev, the parent company of Anheuser-Busch, included only three main categories, but their visualization includes many more subcategories (32 total).
Other companies mapped their tech to the customer journey. This made much more sense to me at first, until I realized it often left out the important step of strategy and planning, starting instead with acquisition.
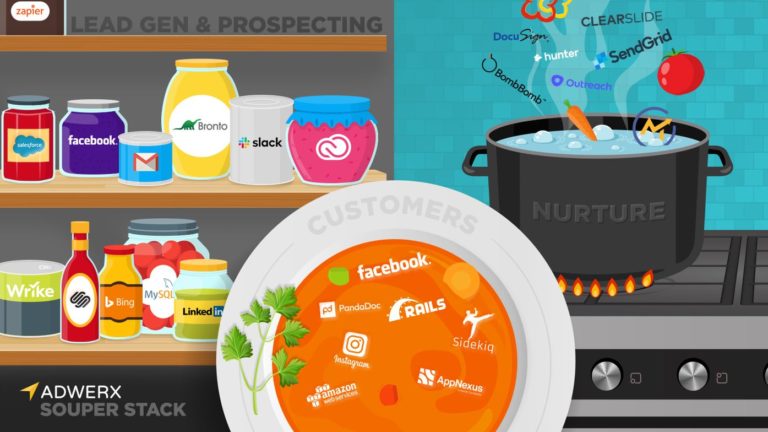
AdWerx Enterprise, a marketing automation platform, grouped tools like Slack, Salesforce, and Facebook within Lead Gen & Prospecting. Theirs was one of my favorite slides, though they weren’t a winner.
Source: Chiefmartec.com
There’s a considerable amount of crossover with tools, which can add some confusion to the visualizations.
For example, as demonstrated in Adwerx’s stack, Facebook can be used for lead generation and prospecting, but also for customer outreach and communication. Elegantly visualizing this crossover wasn’t an easy task.
Top martech categories from Stackies entrants
While there isn’t a fixed list of martech categories in the contest, most entries included a variation of the below list. It’s worth mentioning that these categories don’t have to be linear.
Some entrants represented them in a circle—the perpetual cycle with no beginning or ending, while others represented them as more of a maze, and still others listed them out in funnel form.
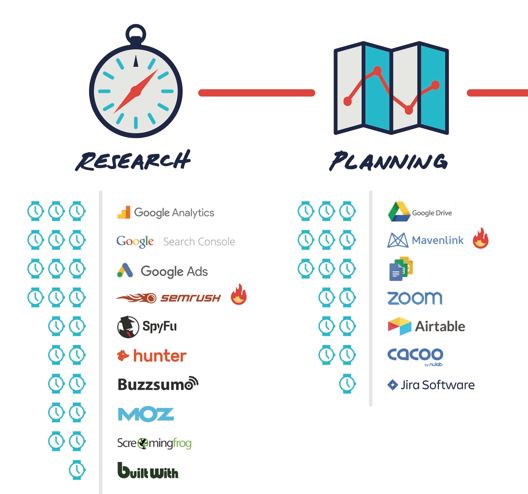
Planning/Strategy: A surprising number of entrants didn’t include strategy or planning in their visualizations. Those that did included research tools which are typically baked into the planning process. Google Analytics, SEMrush, and MOZ are examples. Strategy can mean many things, but it’s dependent on collaboration. The tools people use for this understandably facilitate connection—Zoom, Airtable, Google Drive, etc. The following is a partial view of marketing agency Element Three’s entry, showing the many tools they use for research and planning:
Source: Chiefmartec.com
Creative: The Creative category includes tools and platforms that enable design and content creation (e.g., Adobe Creative Cloud and Office 365), but also design/workflow collaboration platforms like InVision. Web development/CMS platforms like WordPress and SquareSpace arguably fall within this category too. I like the way New Zealand-based Kiwi Wealth included creative as a separate category within their stack and clearly labeled each step of the marketing process to incorporate a category for design tools, collaboration, and content delivery.
Source: Chiefmartech.com
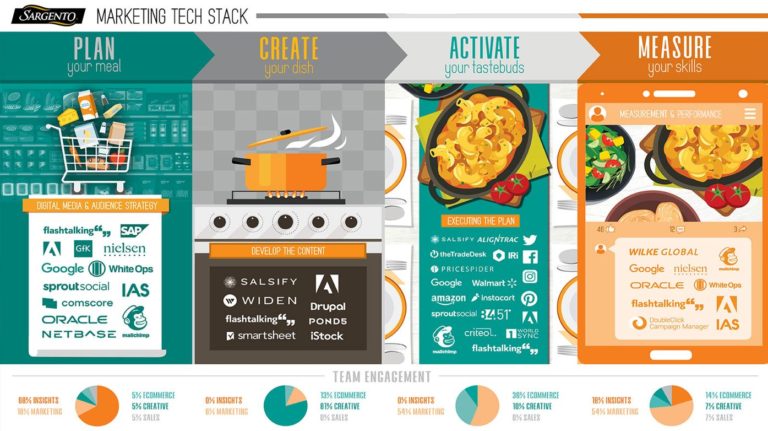
Engagement/Marketing: The combined categories of Engagement and Marketing essentially encompass lead generation and awareness. It’s a wide net here, with tools like HubSpot sitting side by side with ad networks and platforms like Facebook, Instagram, Google Ads, and Wistia. It’s not as easy to visualize this category as it might seem. Many entrants chose to bucket advertising platforms like Google and The Trade Desk into a larger (more philosophical) category. For example, Sargento Foods included them in a category called Activate. Sargento’s stack, one of the five 2019 winners, is also one of my favorites mainly because they kept it simple—just four categories: Plan, Create, Activate, and Measure. Activate incorporates all their engagement and marketing tools, from the commerce experience management platform Salsify to Amazon and Facebook.
Source: Chiefmartec.com
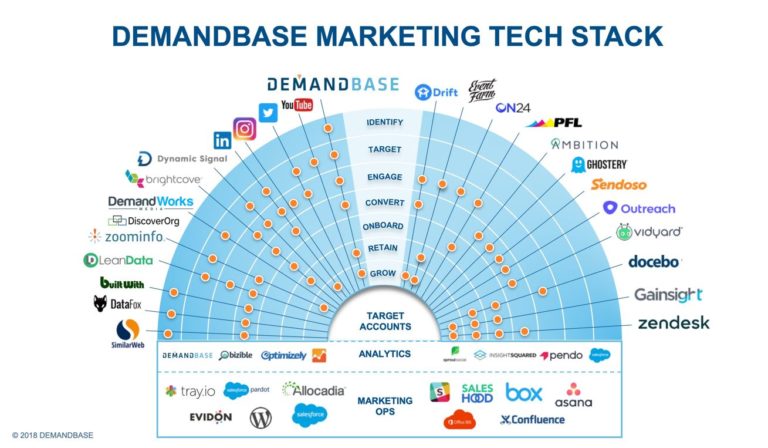
Customer: Many of the B2B entries included the broad category of “Customer” with tools that focus on customer engagement, customer service, nurturing, and retention. HubSpot falls squarely in this category (in fact, HubSpot shows up in just about every category throughout the entries). Customer experience and engagement tools like Adobe Experience Manager, Eventbrite, and Zendesk are examples. ABM-platform Demandbase created my favorite B2B visualization. They illustrated a near-perfect B2B tech stack (in my opinion), clearly illustrating the category crossover that occurs within a complex tech stack that encompasses many tools.
Source: Chiefmartech.com
Measurement/Analytics: If there was any single category that was the great unifier of martech categories, it was measurement and analytics. Nearly all entrants included this category in some form. From Airstream’s “Measure Meadow” to Esri’s “insights & Analytics Viewpoint,” this category tended to include a range of tools. Esri, another 2019 winner, created a beautiful (and simple) visualization of their entire martech process. The analytics category contains robust tools like Adobe Sensei, an AI-based marketing automation tool that works with Adobe Analytics, Informatica, and PowerBI (business intelligence reporting).
Source: Chiefmartech.com
One stack to rule them all?
Reviewing the Stackie Entries really clarified the complexity of the martech landscape for me, and the challenges that organizations face in trying to manage and maintain the many tools available to them.
I deliberately focused on the martech side of the Stackie entries, but there are categories missing from my analysis—eCommerce and operations tools like CDPs and DAMs, for example.
Simplicity was the exception rather than the rule with many of the 2019 entries. A key challenge in 2020 (and beyond), will be for companies to not only understand how all of their tech fits together, but how to simplify it.
To this end, it can be extremely helpful to see what martech stacks look like for other companies within your industry which is why I found the Stackie entries so fascinating.
They represent not only the tech use to facilitate a company’s overall growth strategy, but provide insight into their marketing strategy and philosophy.
We asked Scott Brinker of Chiefmartec.com his thoughts on the Stackies. Brinker responded via email: “The discipline of marketing technology management is still quite young. The field has advanced rapidly in a very short time, and as a community, martech and marketing ops professionals have a lot to learn from each other. That’s what I love best about The Stackies: through the generosity of those who share their stacks and the way they conceptualize them, we all benefit from seeing a wide variety of real-world examples of martech toolsets. It’s a gold mine of ideas, patterns, and trends over time.”
Digital business key performance indicators (KPIs) designed to assess the progress of digital transformation are still not widely used or universally understood — it’s a key critical success factor essential to continued investment. These metrics and analytics should stand alone initially but always tied to the overall corporate strategic initiatives.
How would you describe your transformation progress? What set of relevant KPIs specific to the digital business transformation effort are your guidance?
With most enterprises already using a robust set of enterprise KPIs to measure the performance of their business, it may seem superfluous to create yet another set of KPIs. However, as with any large transformation or project, it is helpful to temporarily create transitional KPIs for the duration of the digital business effort. In Digital Business KPIs: Defining and Measuring Success, research firm Gartner sets out to look at how enterprise CEOs, chief digital officers and CIOs must move beyond the transformation stage and set metrics and goals that lay out a true digital business journey. In fact, according to Gartner, CEOs, chief digital officers (CDOs) and CIOs must:
Move beyond the transformation stage and set metrics and goals that lay out the digital business journey.
My experience validates the need to work closely from the outset with each senior business unit executive to quantify the potential economic benefits of digitalization.
Use startup-style metrics for new ventures, acquisitions and business models.
FIRST, a huge debt of gratitude for Scott’s continued passion, commitment to and thought leadership of the MarTech industry/community. I want to post this right up front as a Thank you and to share Scott’s desire regarding his content.
Feel free to use and distribute the 3200×1800 slide version of the image in any presentation or article you like, as long as you share it “as is” with attribution. And if you want to print the high-resolution version as a poster for your own personal wall display, go for it.
For any other uses of the high-res graphic, please contact me for permission first. For almost all legitimate cases, I’m happy to grant it. You can also still get the original 2011, 2012, 2014, 2015, 2016, 2017, 2018, and 2019 editions of the landscape.
Yes, it grew once again, by 13.6%, up to a total of 8,000 martech solutions.
That’s after 615 from the 2019 landscape went away, either consolidated with another martech company or simply gone defunct. If you were predicting consolidation, an 8.7% churn rate from one year to the next is pretty significant attrition to support that narrative.
But the rate of new venture creation — or at least new venture discovery in our research — outpaced the forces of consolidation once again. In fact, if we first remove the 615 from last year’s 7,040 count, then the growth of new entries on the landscape was actually 24.5%.
Think about that: 1 in 5 of the solutions on this year’s martech landscape weren’t there last year. That’s almost the equivalent of the entire 2015 marketing technology landscape.
There were other martech companies that were acquired from the 2019 landscape — but they were acquired by firms that weren’t already on the landscape. So those transactions didn’t count as consolidation, just a change of ownership. They did not shrink the net number of solutions available to marketers.
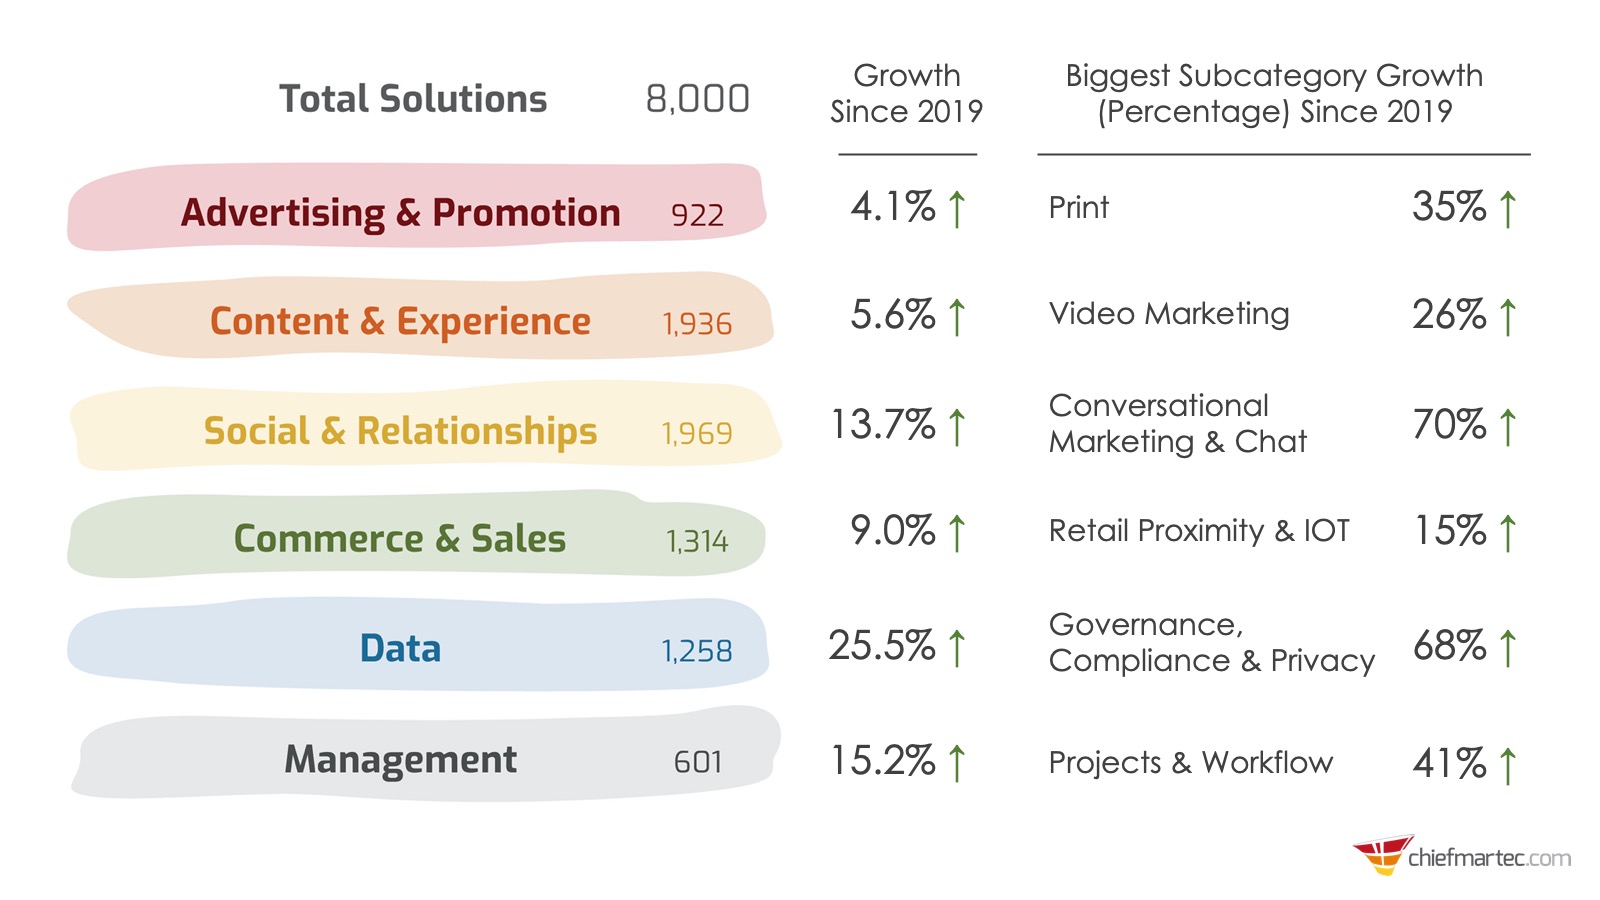
The new design of the graphic this year — more on that in a bit — gave us space to add in a legend with the counts for the number of solutions in each category. Here’s how the categories grew relative to 2019:
Data is by far the fastest growing category, up 25.5%. It makes sense. We have a ton of data. The challenge now is figuring out how to harness it effectively. That’s driving a lot of software innovation in the space.
We also calculated the fastest growing subcategory in each category, by percentage of growth. It’s interesting to see that physical world interactions (print, retail proximity, and IOT), data governance and privacy, video marketing, conversational marketing and chat, and project and workflow management led the pack. These all have been major themes in marketing and martech over this past year.
Forget shiny object syndrome. Martech chases marketers more than the other way around.
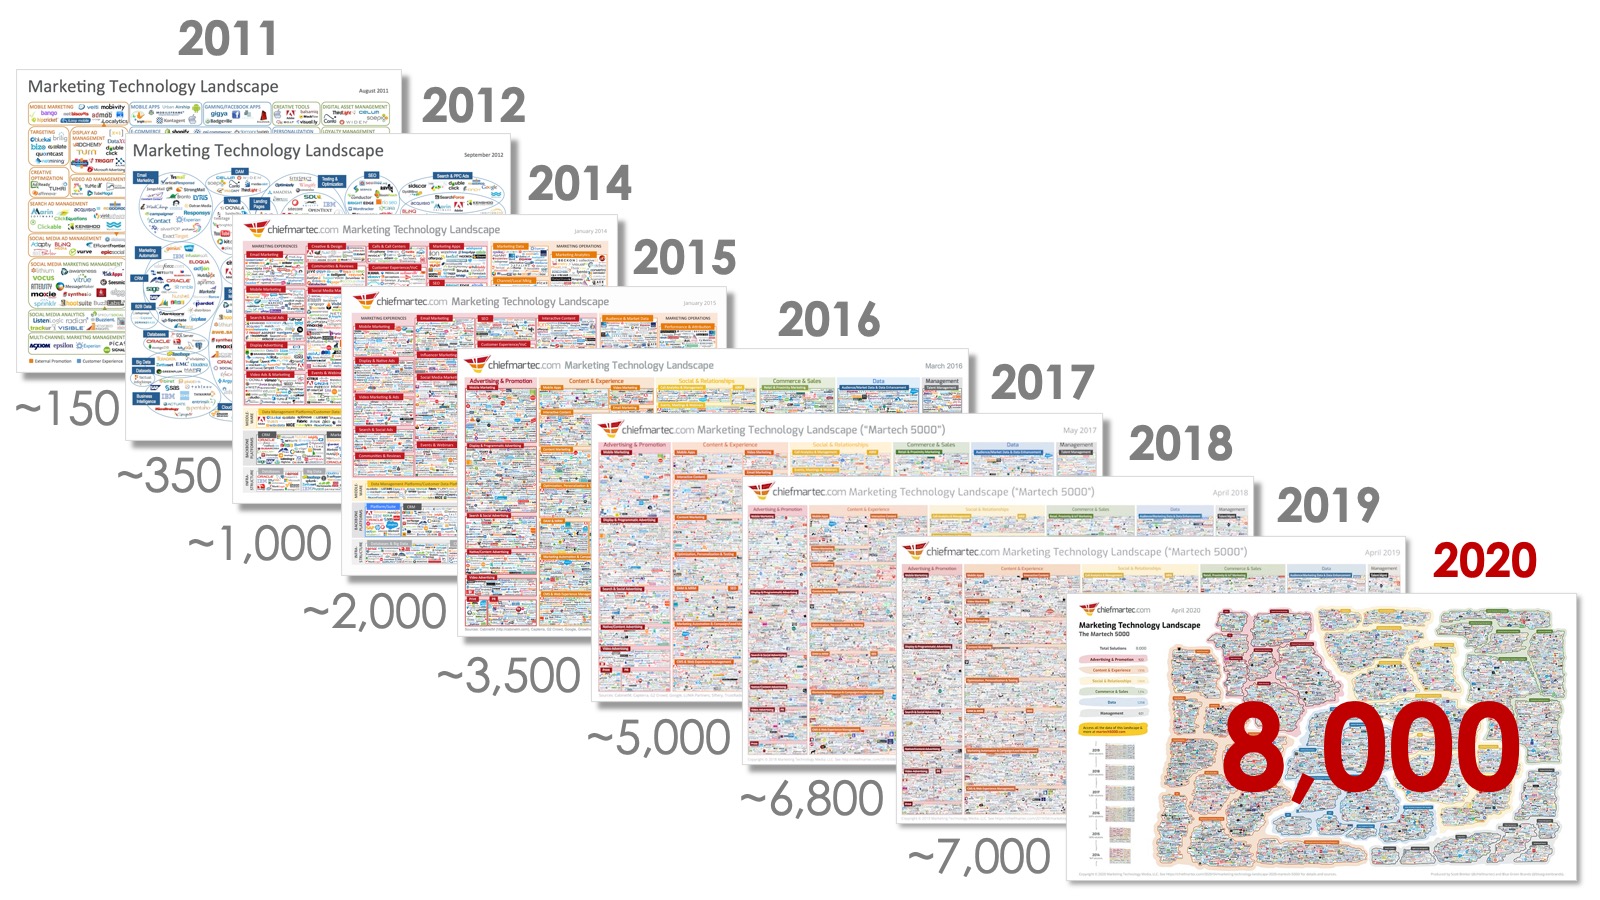
For the record, here’s the complete progression of the overall landscape since 2011:
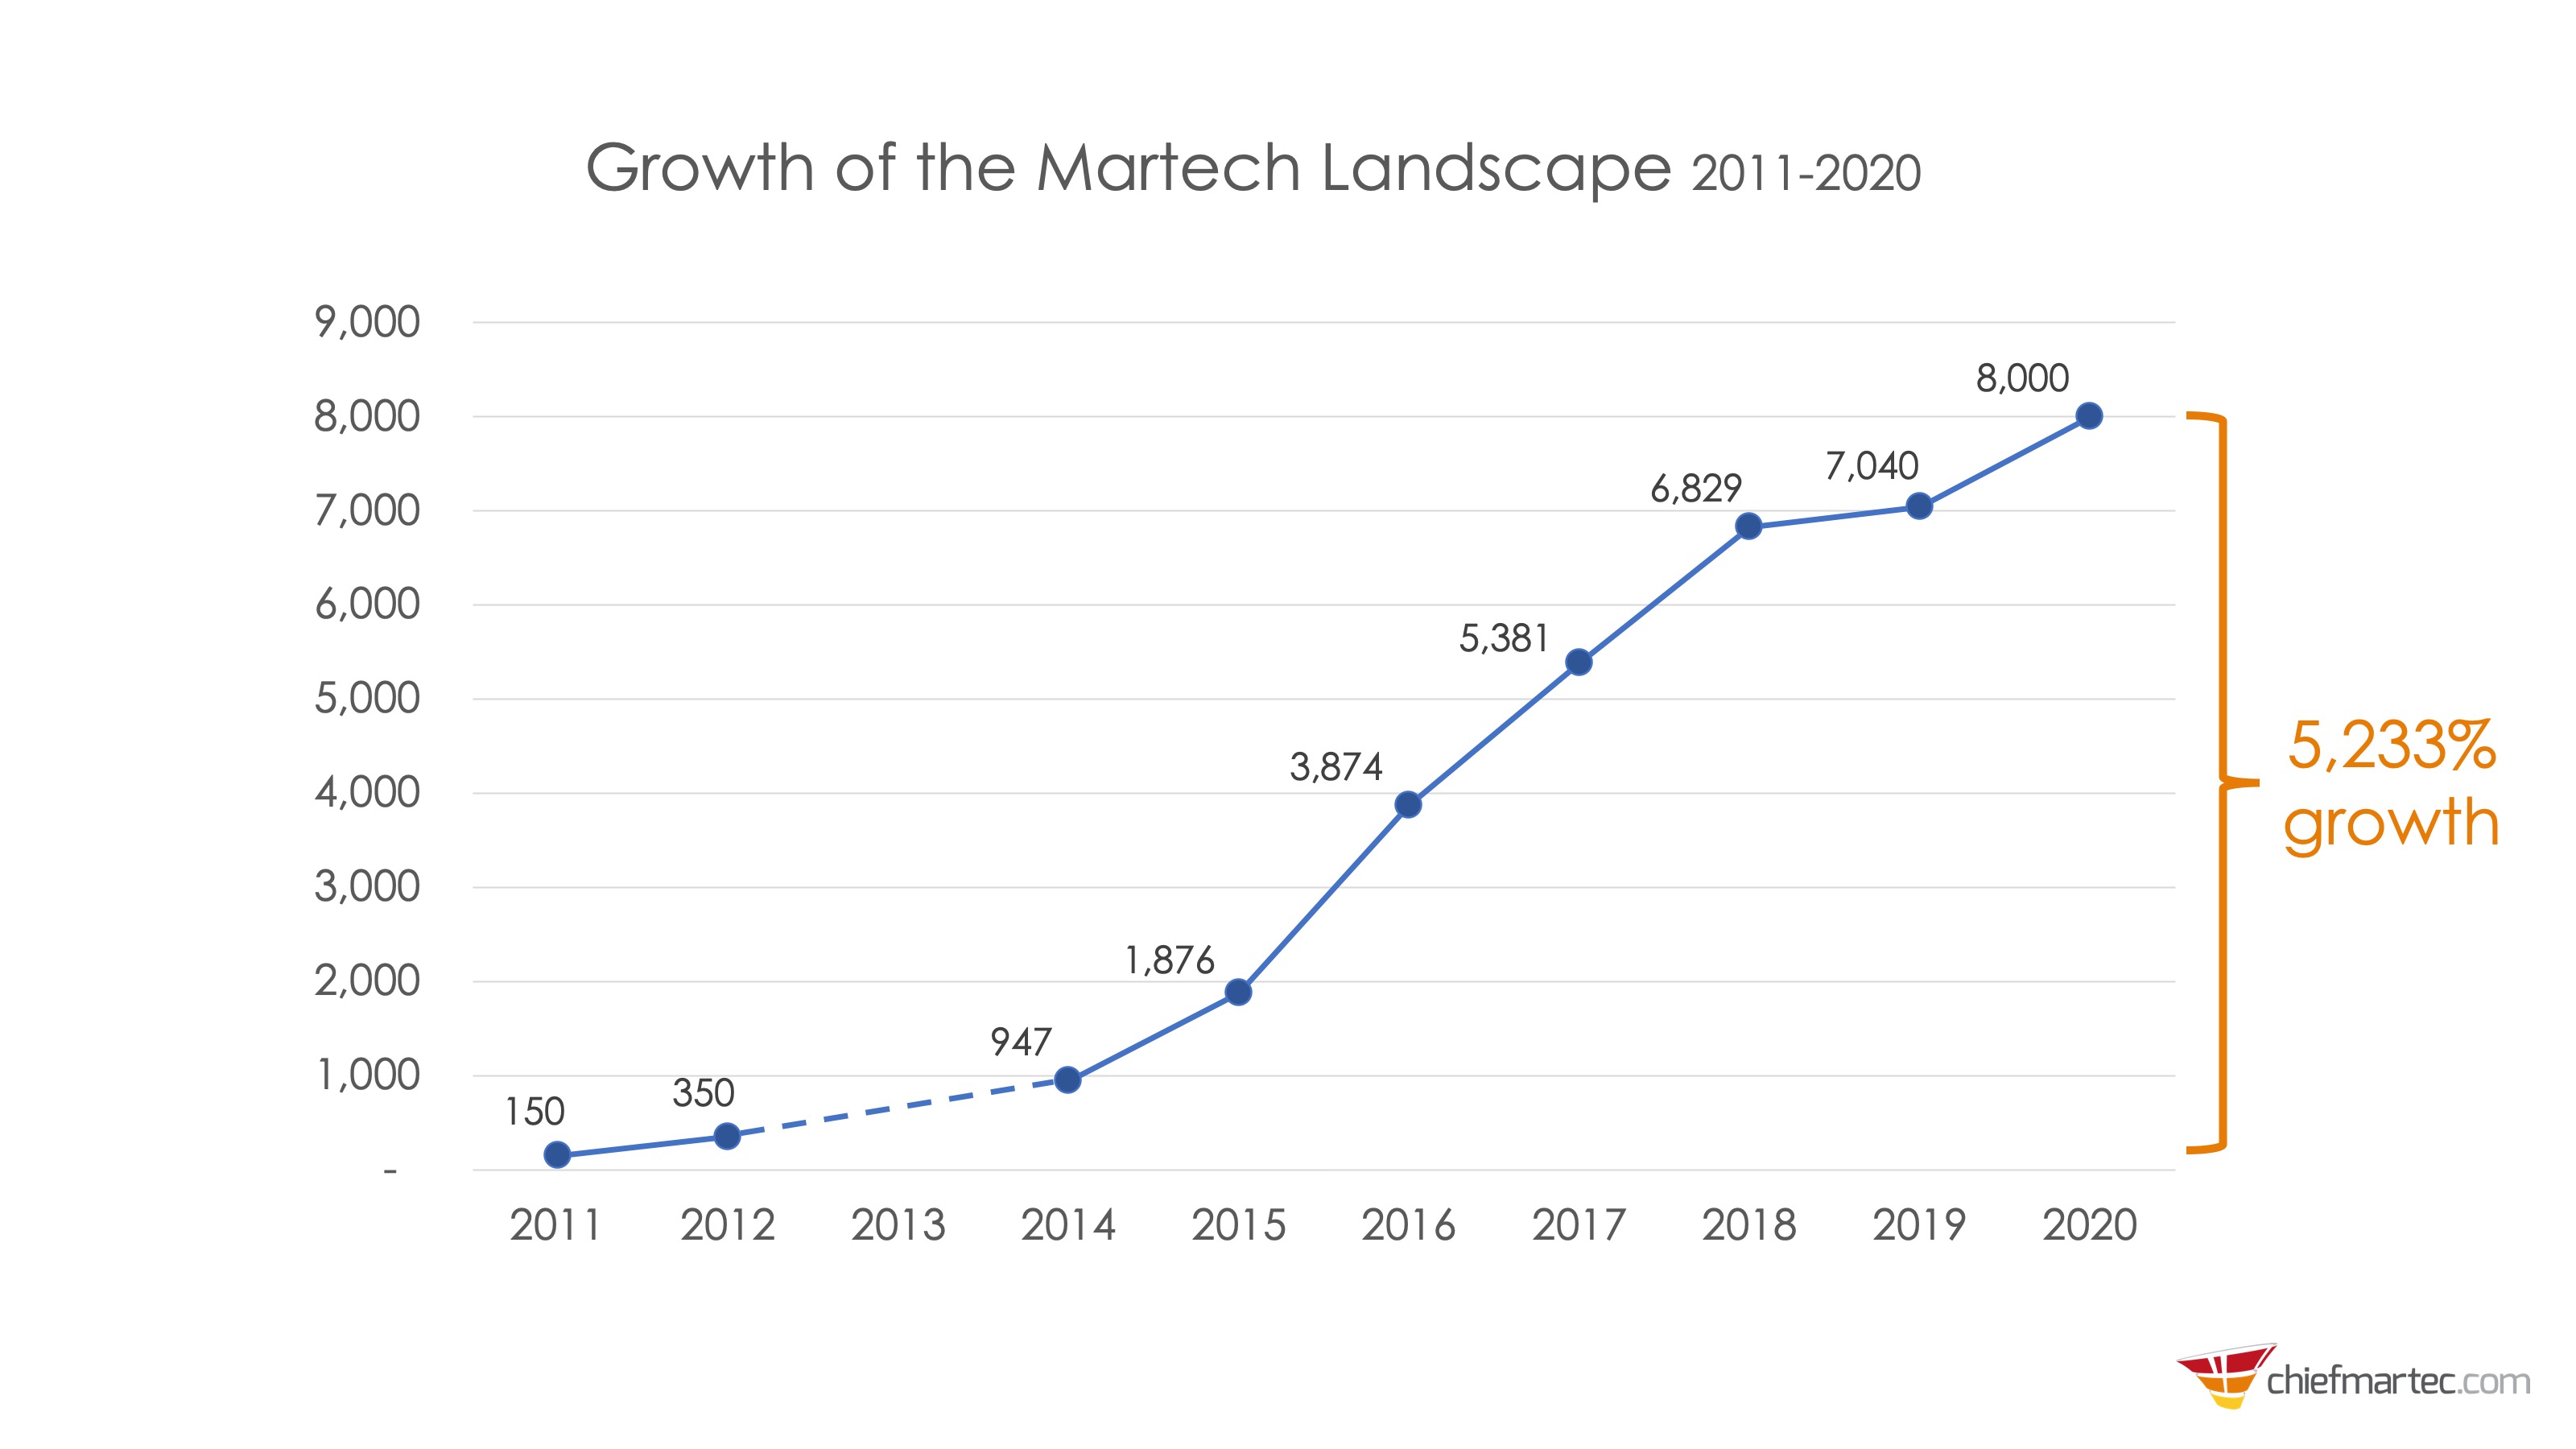
Or, for those of you who prefer a more analytical rendering:
Just a take a moment to reflect on that: 5,233% growth of this landscape since 2011.
Now, this year’s data was collected before the coronavirus pandemic exploded globally in March 2020. The elephant-in-the-room question, of course, is what impact will this crisis have on the martech industry? What will the martech landscape look like in 2021?
Good questions, which I’ll address a little further down in this post.
First, here are official links to the graphic at different resolutions:
Feel free to use and distribute the 3200×1800 slide version of the image in any presentation or article you like, as long as you share it “as is” with attribution. And if you want to print the high-resolution version as a poster for your own personal wall display, go for it.
For any other uses of the high-res graphic, please contact me for permission first. For almost all legitimate cases, I’m happy to grant it. You can also still get the original 2011, 2012, 2014, 2015, 2016, 2017, 2018, and 2019 editions of the landscape.
For any other uses of the high-res graphic, please contact me for permission first. For almost all legitimate cases, I’m happy to grant it. You can also still get the original 2011, 2012, 2014, 2015, 2016, 2017, 2018, and 2019 editions of the landscape.
Now, let’s talk a bit about the design and data before digging into further analysis.
The Martech 5000: 2020 Edition — A New, Organic Design
This year’s martech landscape graphic looks, um, different. Kind of trippy. You might wonder if it has anything to do with us being located in a state that has legalized marijuana. Or perhaps being sheltered-in-place a bit too long. Or both. Plausible explanations, but, no.
The new design actually has a practical origin story. The layout process of trying to tightly pack dozens to hundreds of logos, approximately to the same scale, in a square box of a category is hard. (Literally: it’s a variation of the bin packing problem in computer science that is NP hard.) Just when you get it perfectly packed, if you add or remove a single logo, the ripple effects can force you to rearrange all of them. Trying to grow or shrink a category box triggers the same thing — but across all the other adjacent category boxes too.
You can get a prescription for medical marijuana for the stress that causes.
So the team at Blue Green, who produced this year’s landscape again, came up with a clever solution. Instead of fitting the logos to the box, fit the “box” to the logos. Pack the logos in a cluster, keeping their relative scale and proximity close to constant, and then just draw the border around whatever natural shape that cluster happens to take.
It’s still challenging to then pack the natural category clusters together and maintain a roughly 16:9 aspect ratio for the entire graphic. But having some slack within the packing algorithm cut the overall layout time by more than half. (There’s a general lesson here about building in slack for adaptability over perfect optimization in an ever-changing environment.)
But aside from its pragmatic production value, this approach resonated with me for several reasons:
This year’s martech landscape looks different, right at a glance. A fresh design reminds us this is still a vibrant and evolving space. So much has changed over the past five years in martech. The landscape graphic should reflect that.
The organic nature of this design better reflects the nature of martech. It’s a more fluid and amorphous space than stacks of nice, neat boxes would imply. Instead, this conveys the fractal characteristics of the industry, while still providing some basic organizational structure.
It’s more a work of art than a left-brain data visualization. I don’t mean that pretentiously. More humbly, the bigger this graphic has become, the less utility it’s provided. It’s nearly impossible to “use” it for anything other than communicating the eye-popping scale and diversity of martech — or taking an exploratory random walk through categories. This new design helps dispel the myth of utility. But hopefully like art, it evokes thought and emotion. (Maybe not always positive emotions.)
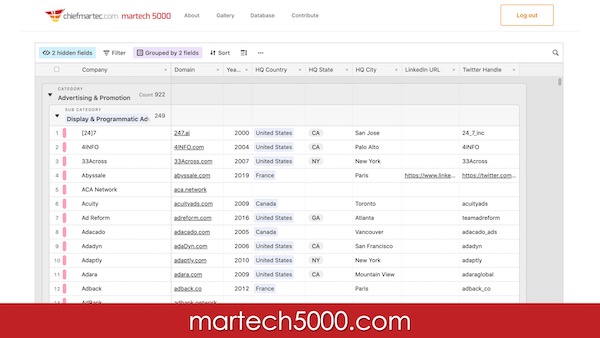
Now, if we really wanted to provide utility, then we should just publish a database with all of these martech solutions in a format that could easily be searched and filtered.
We’ve launched martech5000.com, a site where you can access all the data of the current martech landscape. Actually, even more current than the graphic, as we’ll update the database continuously, whereas the graphic is more of a once-a-year snapshot.
When I say “we’ll update,” I’m not using the editorial “we.” You, as a member of the martech community, can contribute your udpates too: new solutions that we missed and existing solutions that have changed, been acquired, or gone away. We’ll moderate those suggestions, so as to avoid the data set turning to mush.
So if we missed your martech company, please add it to the database at martech5000.com.
To access this database and make contributions, you simply need to create an account on martech5000.com with your name and email address — and give us permission to email you as a subscriber to chiefmartec.com. We won’t share your info with anyone else, and we won’t spam you with other people’s ads.
Speaking of data, let me give credit where it’s due here.
Blue Green did almost all of our primary data research this year. Their Herculean effort and passion for martech made this possible. But we also received extraordinary contributions from MarTech Alliance, Martechbase, and MarTech Tribe, who each shared significant data updates with us from their own research. In fact, many of the newly discovered companies were from the European martech landscape that Martech Tribe produced earlier this year.
Other sources we relied on for research martech companies include CabinetM, Capterra, G2, LUMA Partners, and TrustRadius. Anand Thaker helped shape our data collection methodology when co-producing the 2017 and 2018 landscapes. And Terence Kawaja of LUMA Partners first inspired us with his original adtech LUMAscape.
I named the site martech5000.com because I am willing to bet — at least bet a domain — that the number of martech solutions in the world will not drop below 5,000 for the rest of this decade.
Which is a good segue…
The Shape of the Martech Industry in 2020 and Beyond
Ever year I’ve published the martech landscape, since 2011 on, people have been pointing at it and confidently predicting it would consolidate. Usually within the next year.
Yet every year the landscape has grown. It’s now 50X the size it started at.
But those two statements aren’t as mutually exclusive as they might seem. The number of martech solutions has grown. It’s just empirical fact. Yet the industry has also consolidated. Here’s how that happens without a time-space paradox:
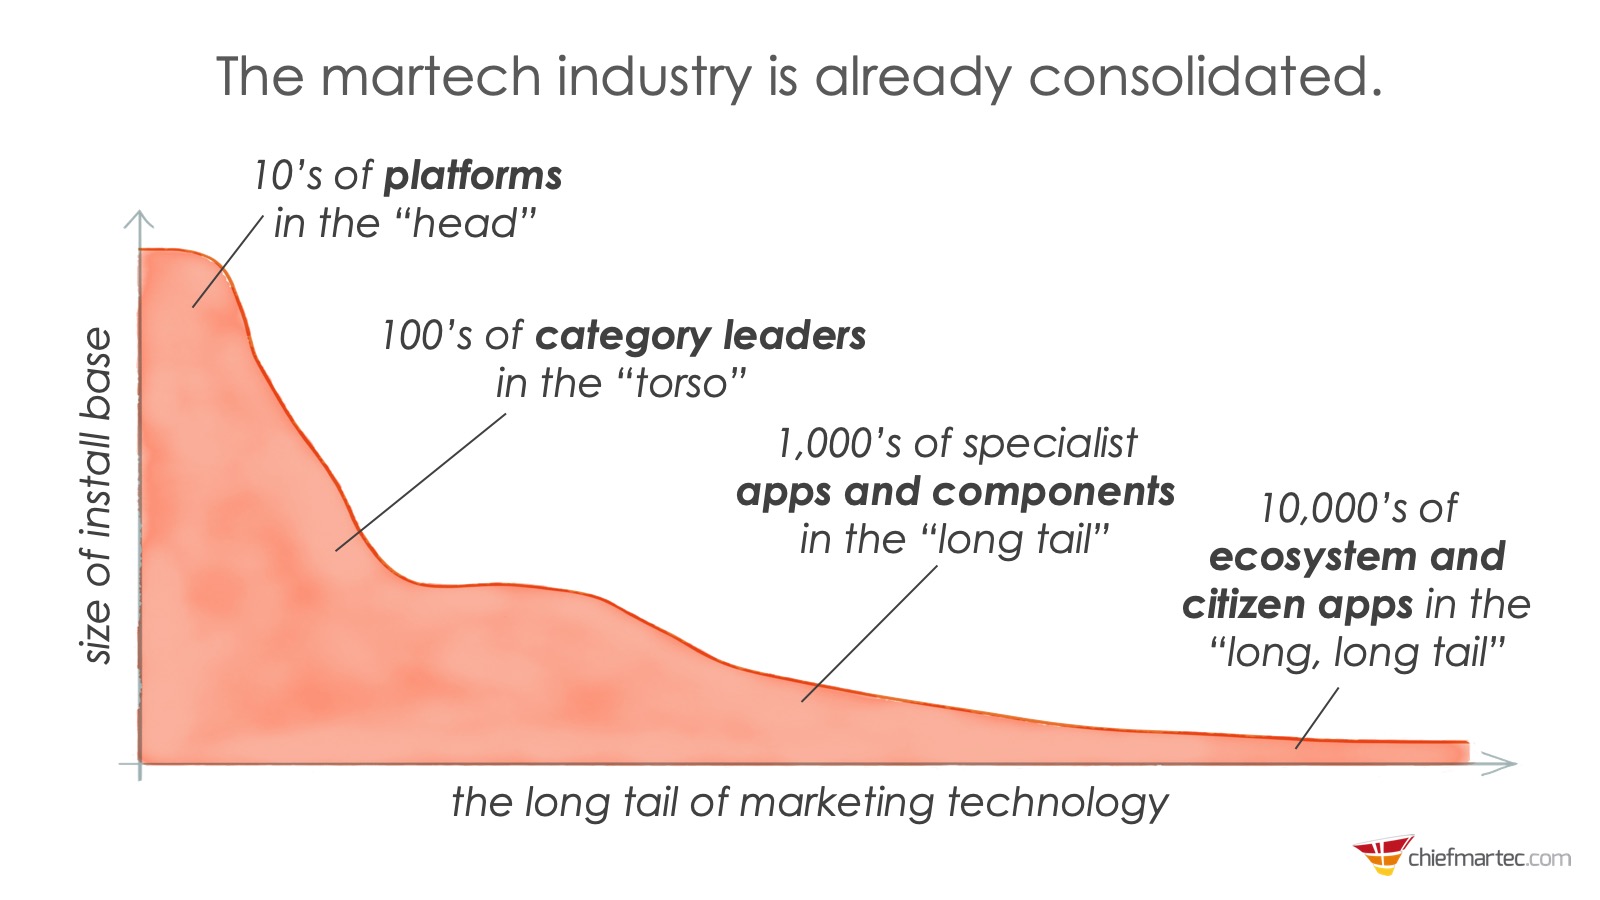
The martech industry is a long tail. There are a consolidated number of platforms that dominate global market share. Maybe a dozen or two. Rattle off the top names that come to mind, and you’ll have the gist of the “head” of the tail. (An interesting debate is whether consumer platforms like Facebook qualify. Or cloud infrastructure platforms like AWS.)
Then there are a few hundred category leaders. Their solutions are more focused and dive deeper on a particular capability — say, social media management — but they still have tens of millions or even hundreds of millions of dollars in revenue. (Keep in mind, martech is a $121 billion industry overall.)
And then… you have a long tail of thousands of specialists and startups. Many aspire to be the next major platform. Or at least the next category leader. And some will achieve that.
But plenty of others aren’t betting on a moonshot. They’re simply running good businesses.
Here is the thing that confounds those who only consider a martech company to be “real” if they’ve raised a ton of venture capital on a unicorn trajectory: company valuation is not the same as customer value. Many small martech firms solve specific pain points or open up new — if sometimes narrow — growth opportunities. And their customers love them for it.
They may have a small number of customers. Or the slice of capability they provide might be thin enough that their ACV is only a few hundred or a few thousand dollars.
But thanks to cloud economics — i.e., it’s insanely cheap and easy to dynamically scale SaaS on Amazon, Google, or Microsoft cloud infrastructure — and product-led or services-led growth, many of these small martech companies are… wait for it… profitable.
That also makes them sustainable. They’re not beholden to investors for the next round of funding to survive. Indeed, many of them are bootstrapped from the get-go.
They might be as small as a “micro ISV” — a couple of entrepreneurial developers who turn a passion project into a solid business. Don’t dismiss that. I’ve seen quite a few million-dollar products built that way. Splitting that revenue two ways, while having fun, running their own show, and enjoying genuine connections with happy customers can be very fulfilling work.
Others scale up to dozens or hundreds of employees. Or blossom within a larger services business that has found a way to “bottle their special sauce.”
Almost none of these will ever raise top-tier funding on Sand Hill Road. But collectively they are an essential part of the martech industry. They fill the myriad of gaps that the major platforms can’t — because it’s not economically feasible for a multi-billion dollar company to chase niche opportunities worth only millions or even tens of millions of dollars. Yet customers still crave such solutions crafted to their diverse and varied needs.
A wonderfully symbiotic relationship is emerging here. The major public martech companies have come to realize that this legion of long tail builders and entrepreneurs can be their allies. The stability of a major platform as the backbone of a marketing stack augmented with a set of specialized apps designed to plug deeply into that platform is a powerful combination.
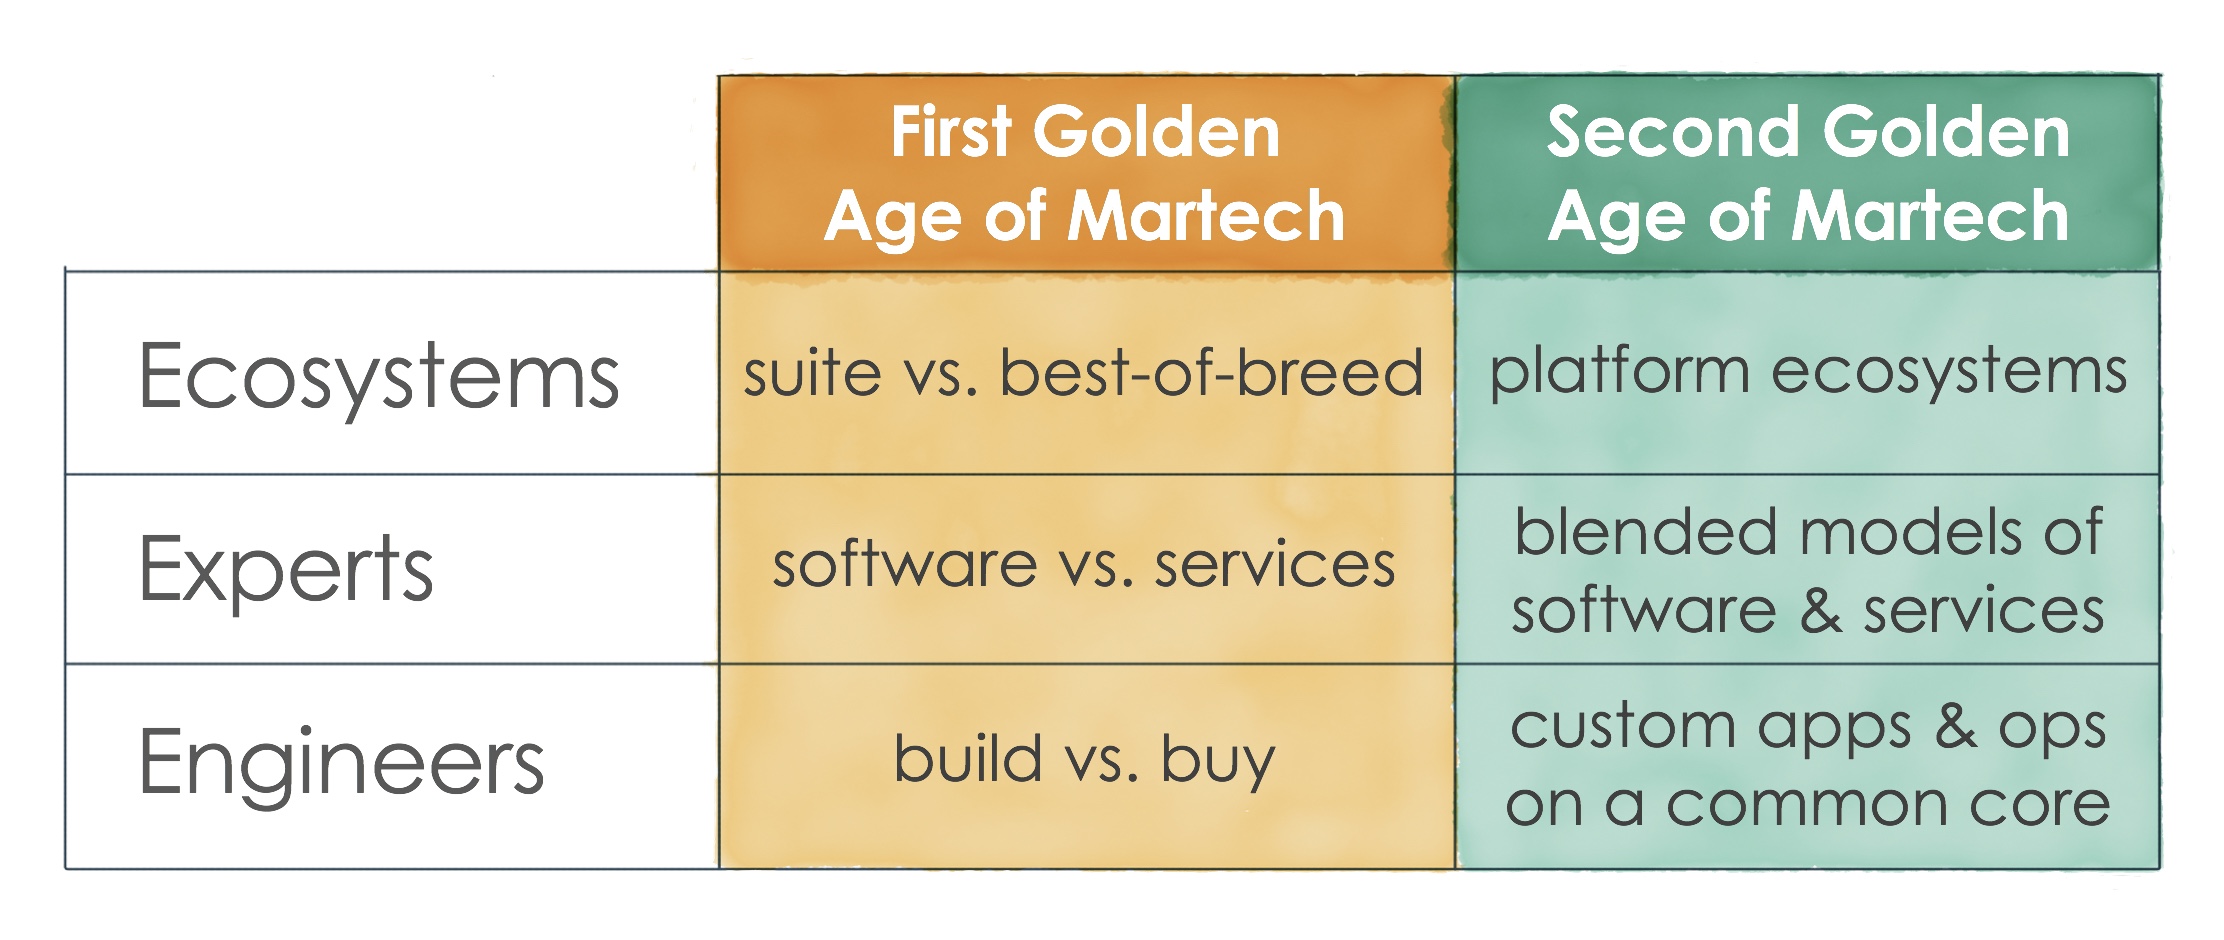
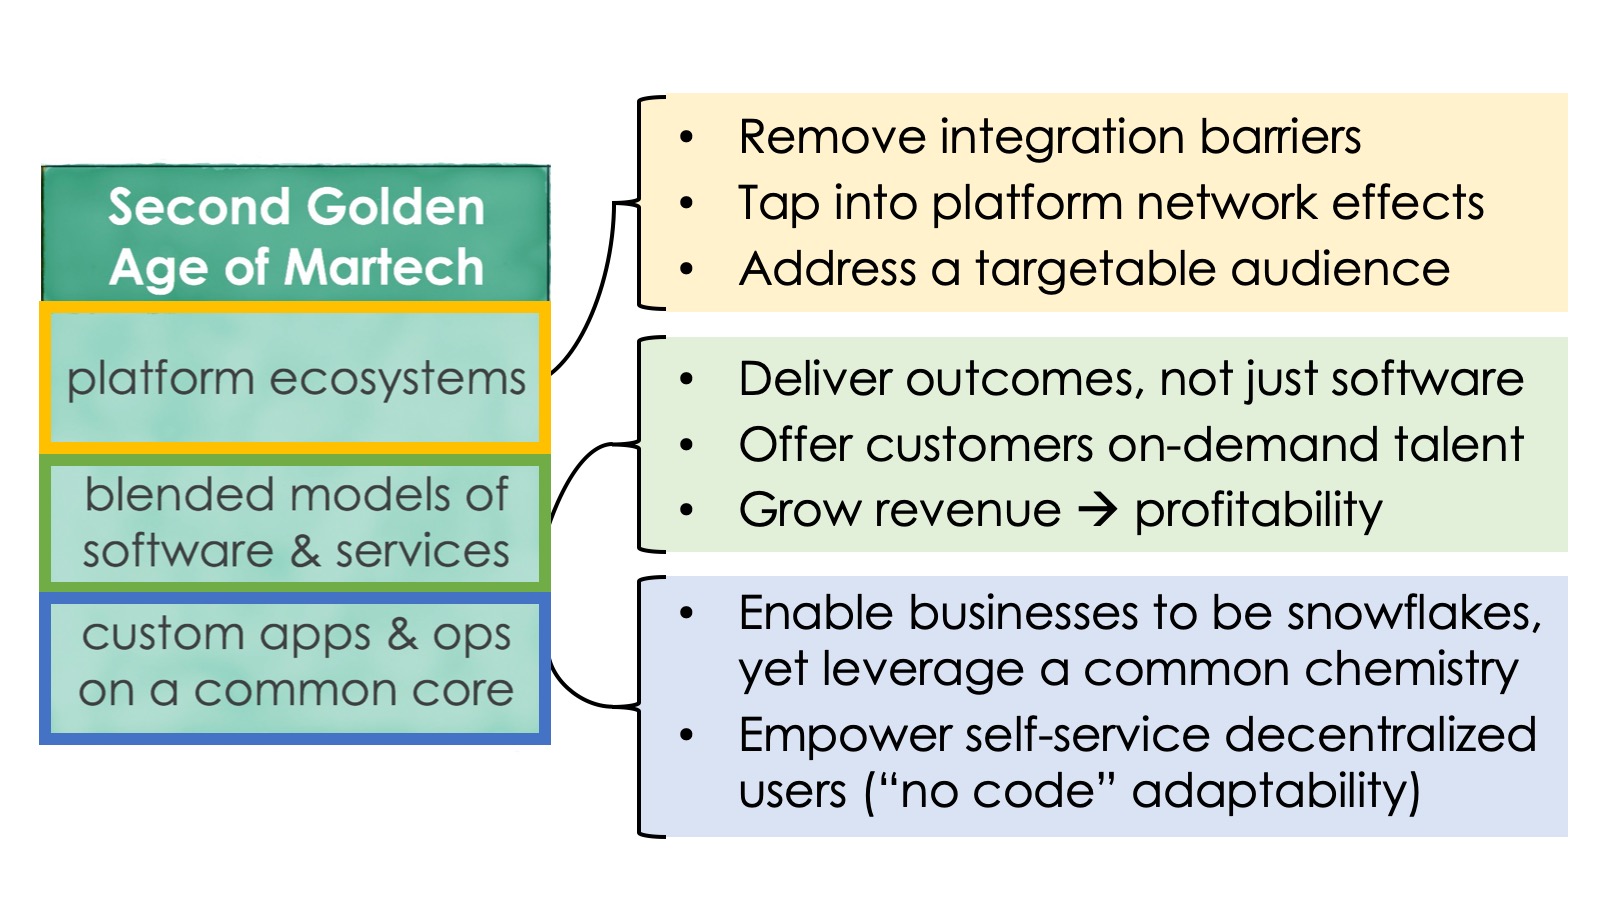
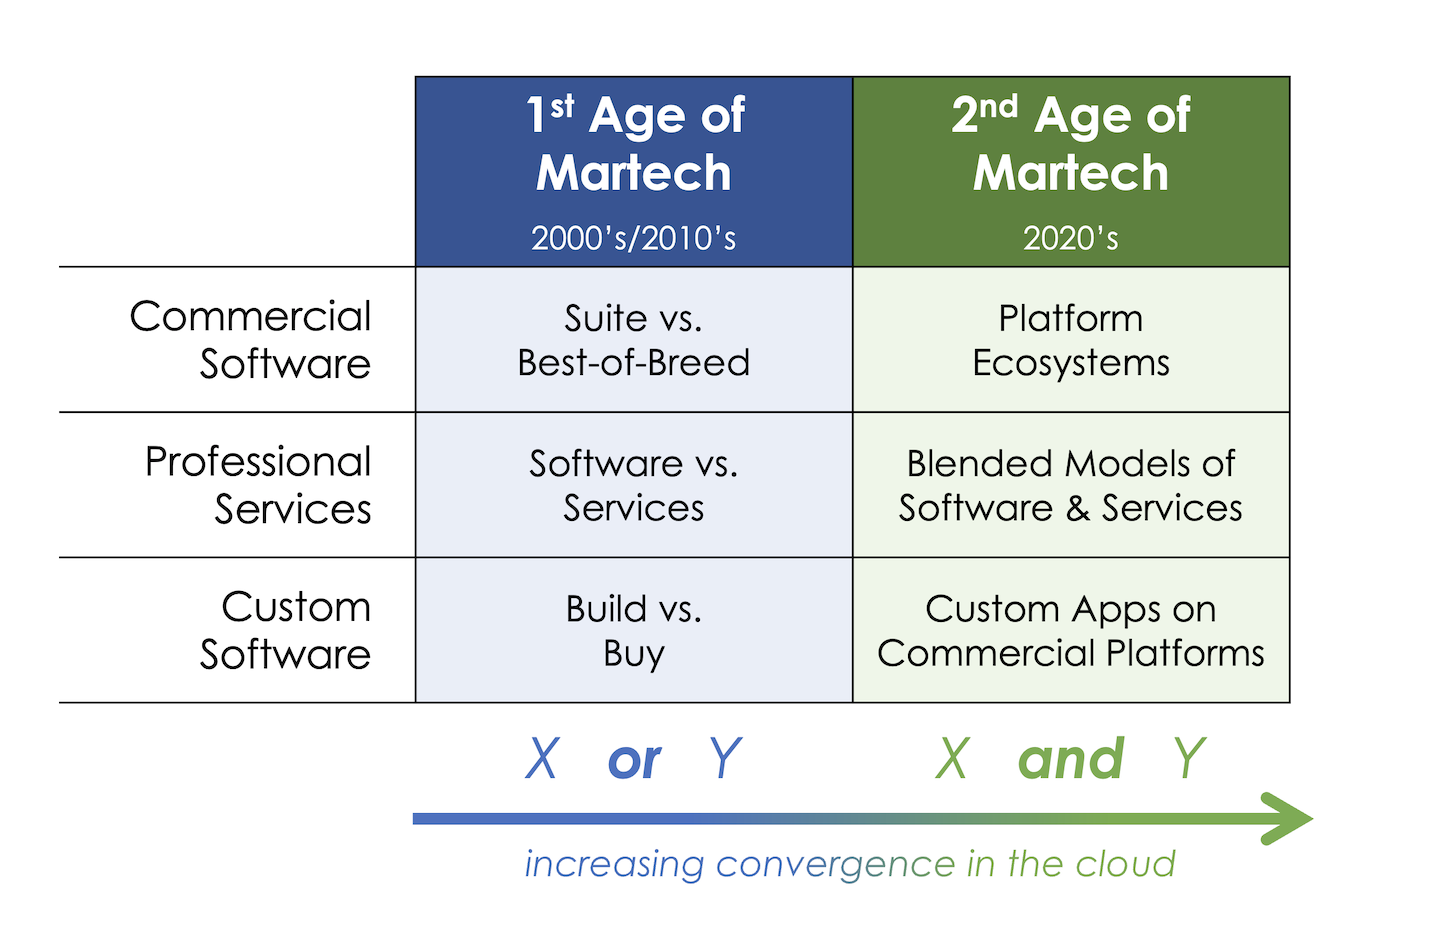
A “point solution” — which used to be a negative label — isn’t a point solution any more when it seamlessly integrates into your primary platform. It becomes part of the fabric of your stack. Literally: it’s a feature, not a bug.
Instead of suite vs. best-of-breed, marketers get the best of both. Many of these ecosystem solutions also blend software and services to help marketers achieve outcomes as much as technical capabilities.
At the same time, these characteristics give long tail martech businesses a certain degree of robustness. By integrating deeply with a major platform, they overcome buyer objections to unintegrated software. They tap network effects with other integrated apps that can benefit from each other’s data and services. And they can focus their marketing and sales energies toward a well-defined target audience — customers of that platform — often through online marketplaces run expressly for that purpose.
(Yes, given my role at HubSpot, I’m biased on the advantages an ecosystem can provide. But these dynamics aren’t unique to HubSpot. You can see ecosystems thriving around almost all of the major marketing platforms out there.)
But What Will Happen With Martech in 2020 Now?
Other things being equal, I believe the martech industry will remain rich and diverse for the decade ahead. Heck, I’m betting on it with my martech5000.com domain. Even with plenty of consolidation, the volume of net new software creation — although likely more ecosystem-oriented software — will continue to be robust.
There is an ever-renewing spring of opportunities to make marketing better and few barriers to building an app in the cloud to address them.
But other things aren’t equal. Certainly not this year.
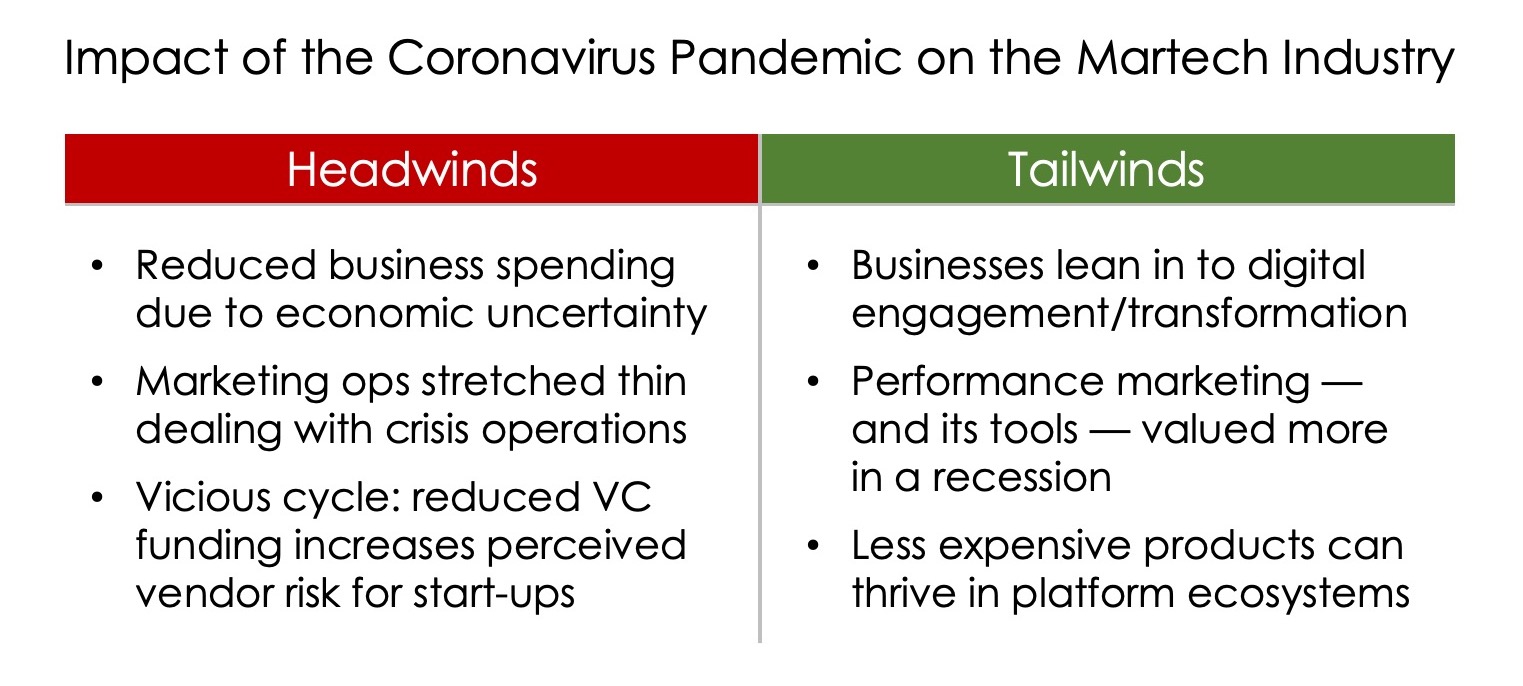
Will the coronavirus crisis ravage the martech landscape? Maybe. But I think we’re looking at more of a short-term hit than a long-term death. The next year will likely be rough for a lot of martech vendors, if for no other reason than it’s going to be a tough time for their customers. Economic wake. More will exit the field than would have otherwise — and that’s on top of the “dot com” moment many felt we were already facing. That increases both real and perceived vendor risk for VC-funded ventures, which is a bit of a vicious cycle.
On top of that, marketing operations teams — in many firms, the gate-keepers to the martech stack — have their hands full with crisis-related issues for the immediate future.
However, while there are serious headwinds for martech in this crisis, there are tailwinds too:
The world is going to continue to become more digital. If anything, this crisis will accelerate the motivation for firms to embrace digital operations and digital customer experience. And that’s where martech thrives.
Most martech solutions tend to have a “performance marketing” bent to them. Those that can deliver results will be especially valued in a time when marketers have to justify every cent.
And, yes, back to ecosystem dynamics again: eliminating both the headaches of integration and the overhead of too many solutions overlapping with their own implementations of what should by now be common, underlying platform functionality will bring greater cost efficiency to martech builders and buyers.
As the headwinds eventually subside — and they will — I believe those tailwinds will carry the martech industry far forward through the decade ahead.
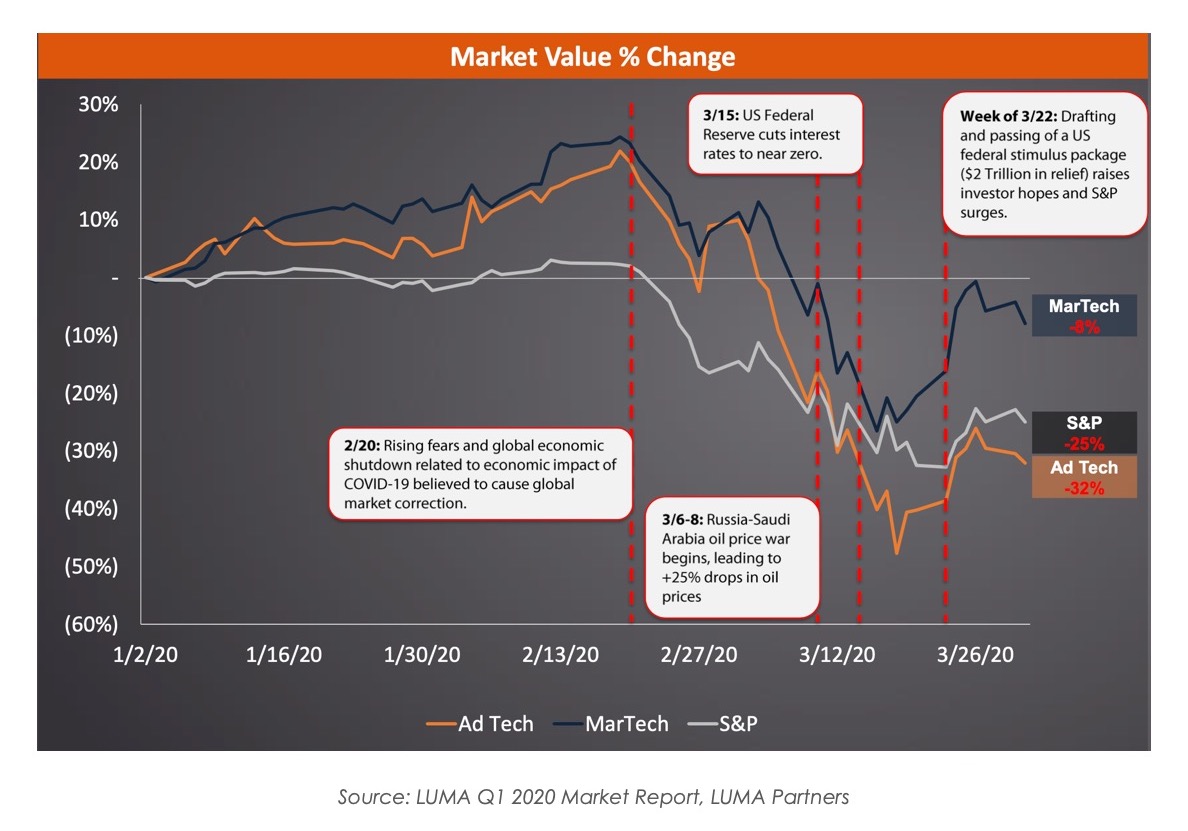
Of course, this is just my opinion. However, I will share this chart from LUMA Partner’s Q1 2020 Market Report, showing how public markets behaved as the COVID-19 crisis erupted:
LUMA’s tracked bundle of martech stocks suffered along with pretty much the entire market. But not to the same degree. In particular, at the end of March, when the S&P was down 25% from the start of the year, martech was only down 8%.
Necessary disclaimer: this is not investment advice.
But it is evidence that I’m not the only one who’s bullish on the future of martech.
It won’t be a cakewalk getting to that future. Recovering from this crisis will be a challenge. But I have faith the marketing and martech communities.


